Stocks (ex BFSI) which looks interesting to me from a one year perspective. Why one year? We live in a VUCA (volatile, uncertain, complex and ambiguous) world so its hard to imagine far ahead.
Ahluwalia Contracts
Carborundum Universal
Chambal Fertilisers
Cochin Shipyard (slightly longer horizon here)
GE Shipping
GHCL
Gulf Oil Lubricant
JK Cement
KEC International
Kirloskar Ferrous
Persistent Systems
PTC India
Suprajit Engineering
TV Today Network
VST Tillers Tractors
In case of any incoming information which negates my thesis on any company, I may exit.
This is how Mr K M Sheth, Chairman of GE Shipping describes running shipping business successfully in the FY17 Annual Report:
Shipping is a truly global business in every respect as well as a cyclical and volatile one in which many moving parts across the world have a bearing on earnings as well as asset values. It is not unusual to see swings of 50% or more in earnings and swings of 30% or more in values within a period of twelve months.
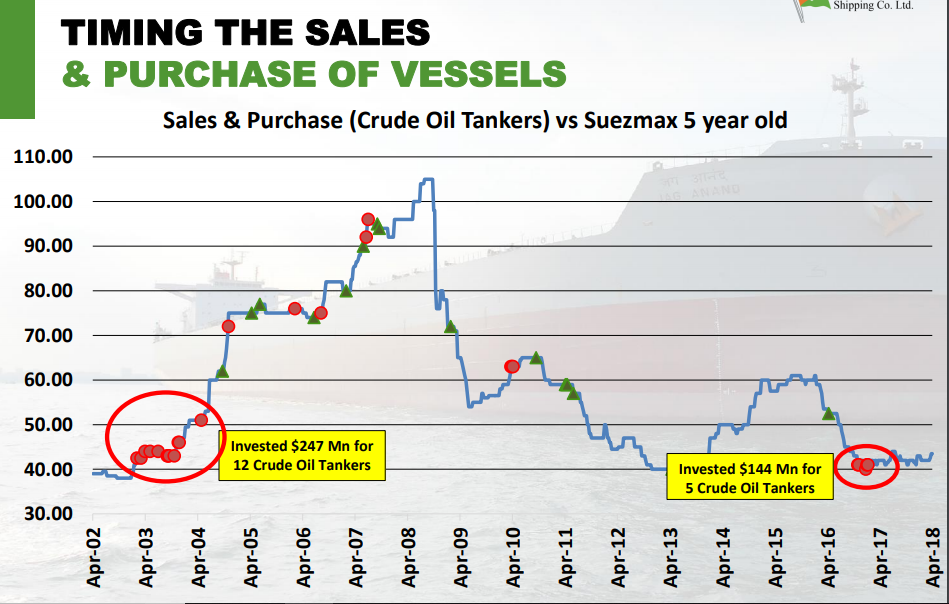
At its core, success in the commodity shipping business can come by doing two basic things well: buying and selling the right ships at the right price and time, and running the ships well in the interim.
Interest and depreciation, which are directly affected by the capital cost of the asset,constitute almost half of our operating cost base. This shows the key role that the acquisition price of ships plays in our profitability.
We have done a lot of work trying to identify the right price for different types of assets. In most cases, this coincides with very weak freight markets, which means that charter rates are not remunerative if not loss making, i.e., earning a very low or negative current yield.
It is not possible to time troughs and peaks perfectly. However, we expect that investing with such a ‘value based’ rather than a ‘momentum-based’ approach will deliver US dollar returns on capital in excess of 10% over an investment horizon of 3 to 5 years. With some leverage thrown in, this can translate to an even higher return on equity.
Company attempts to manage volatility risk in various ways. If the Company believes that the freight market could weaken, it may enter into time charter contracts ranging from 6 months to 3 years. Another method of managing risk is by adjusting the mix of assets in the fleet through sale or purchase of ships.
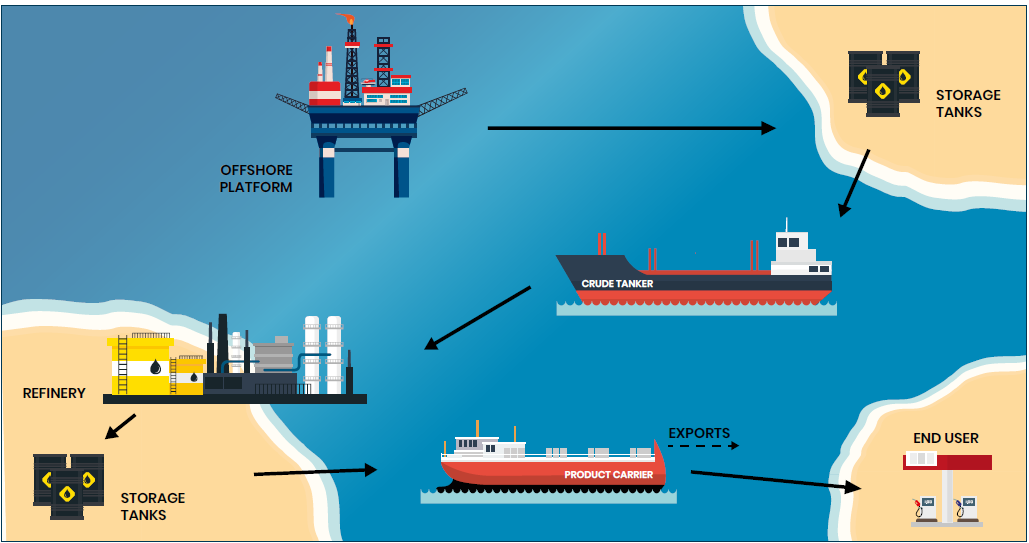
Sub-sectors/Asset classes of GE Shipping:
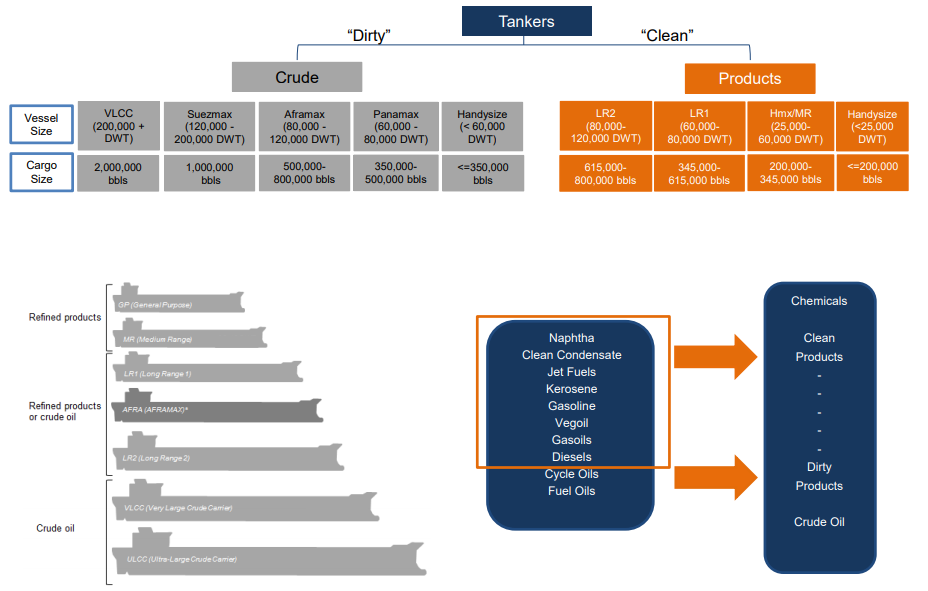
Crude Oil Tankers
Two types of Tankers and their usage as explained below:
Currently, GE Shipping owns 7 Suezmax of 10,76,376 dwt and 5 Aframax of 532,307 dwt. They owned 4 Suezmax crude carriers of 610,797 dwt and 4 Aframax carriers of 426,314 dwt as at March end 2016 resulting into 76% and 25% increase in Suezmax and Aframax tonnage capacity respectively over last two and half years.
In FY16, crude tankers, inclusive of ‘spot’ and‘period’, earned an average TCY of $ 31,913 /day (FY15: $21,650/day). The strong earnings were, principally due to the following factors:
All oil producing nations upped their production levels and then continued their record high production even as oil prices fell.
The surplus in crude availability translated directly into higher volumes shipped around the world, as refinery margins soared, demand spiked at lower prices, refinery maintenance was postponed and plants ran at historically high rates across the board.
The lower oil prices spurred large scale stock-building (Commercial and Strategic).
The crude fleet growth was modest in FY 2016 coming in at about 2.8 %.
The earnings were also helped by the drop in the price of bunkers in tandem with oil prices from more than $300/tonne at the start of FY16 to less than $ 200/tonne by the end of FY 2016.
Similar factors can probably play out again in 2019
In FY 17, crude tankers, inclusive of ‘spot’and ‘period’, earned an average TCY of $ 21,853 /day. In FY18, average spot earnings fell 42% YoY.
In Q2FY19, avg TCY was $10,373/day vs $15,975/day YoY. In H1FY19, avg TCY was $10,692/day vs $15,779/day. As can be seen, TCY has fallen from the peak of $32k to $10.4k recently. There is light at the end of the tunnel. In October, Suezmax rates have shot up significantly to around $30k/day and Aframax to around $25k. In November, spot rates for Suezmax hit as high as $50,638 while Aframax has been stable around $25k/day as per Clarkson data. Certainly, the worst in terms of freight rates is behind us. Marginal new fleet supply in 2019 should ensure that rates average around $25k/day going forward which along with capacity addition over last two years should lead to significant increase in cash flow generation.
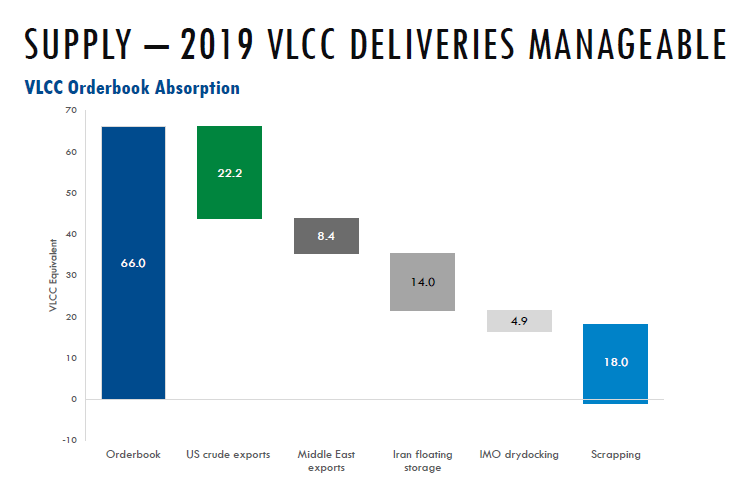
Risks to high freight rates are fleet growth of 7% in CY2019 and probable OPEC production cuts though the biggest listed crude tanker operator Euronav believes the additional fleet supply can be absorbed by the market as the chart below shows
2. Product Tankers
GE owned 4 Long Range One (LR1) carriers and 9 Medium Range (MR) carriers as at March’16. Over the last two and half years, GE has added one Long Range Two (LR2) and 3 MRs.
Similar to the trend in Crude tankers, Product freight rates have almost halved from the peak and at the lowest level in Q2. MR Rates have since then strengthened by around 20%.
Period
TCY/day
FY16
$20,155
Q3FY17
$16,285
Q4FY17
$15,868
Q1FY18
$15,432
Q2FY18
$13,833
Q3FY18
$15,259
Q4FY18
$14,598
Q1FY19
$14,697
Q2FY19
$10,323
Factors influencing freight rates:
Inventory build-up and arbitrage opportunities
New refinery capacity away from oil consuming countries, end oil consumer demand, seasonal refinery maintenance shutdown
Net fleet growth/orderbook. BIMCO estimates net fleet to grow by 2.4% (lowest since 2012) next calendar year.
Crude oil tankers cannibalise when their earnings are lower leading to oversupply of vessels
IMO 2020 regulations require cleaner fuel for seaborne trade leading to higher demand in 2020.
3. Gas Carriers
GE owns 6 Gas carriers now of which 3 added in the current FY from just one Very Large Gas Carrier (VLGC) as on March’16.
Q2CY18 saw average VLGC spot rates going down to below $10,000 a day and now they are more in the region of $20,000 per day. Timing of carriers purchase and sell track record remains.
Factors influencing freight rates:
Increase in shale production in US, internal consumption and hence LPG Exports from US
New fleet growth. VLGC orderbook as a % of current fleet stands at 7.1% for 2019 and 8.6% for 2020 which shows supply would be high over next two years.
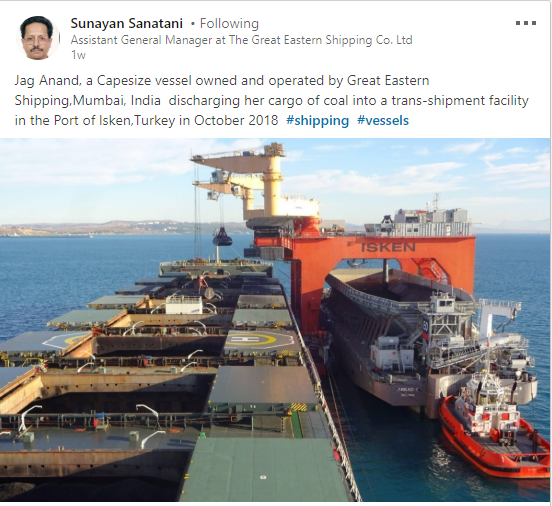
4. Dry Bulk Carriers
GE own one Capesize carrier (pic below), 8 Kansarmax vessels out of which it has contracted to sell one Kansarmax to be delivered in Q3FY19 and 6 Supramax carriers out of which one was sold in July.
Freight rates have been relatively strong and are expected to remain around current levels or lower.
Period
TCY/day
FY15
$9,860
FY16
$6,638
Q3FY17
$6,972
Q4FY17
$8,345
Q1FY18
$9,166
Q2FY18
$8,940
Q3FY18
$12,231
Q4FY18
$11,852
Q1FY19
$13,597
Q2FY19
$12,447
Factors influencing freight rates:
Coal, iron ore (long haul i.e Brazil or short haul i.e Australia) and bauxite imports by China
Fleet growth and scrapping. BIMCO expects net fleet growth ( after considering scrapping) of 3% in 2019 which seems manageable if the Chinese imports continues to grow.
5. Offshore Business
As the Exploration and Production (E&P) spending remain subdued, this part of the business is expected to be depressed going forward from growth perspective. Currently, all four rigs are working. Two rigs have been contracted till early 2021 at lower rates. Utilization of vessels is to improve from last year. Of the old contracts, one is going to get over at this time next year and fourth rig contract will get over in early 2020. Higher utilisation and lower rates will likely result in moderate fall in cash flows going forward.
Financials:
Significant Operating Leverage: As most of the fleets are on spot rates compared to 40-50% spot earlier, every $1000 increase in rates flows to the bottomline.
Debt repayment: GE did a capex of $400mn over last two and half years for purchasing tankers and vessels for which they raised debt. Debt currently is Rs 2850crs. As the earnings cycle improve, asset value of tankers and vessels usually picks up, sale of which along with operational cash flows will be used to trim down debt. No major capex except $18-20mn scrubber installation as GE doesn’t intend to add more vessels in the near future.
P&L Statement: Due to the new accounting standard, liability side of balance sheet gets marked to market while the asset side isn’t due to rupee depreciation while in reality GE is a net beneficiary of weaker rupee as both assets and liabilities are in dollar and hence it makes no sense to look at the Quarterly Profit figures. H1 Consolidated reported loss was Rs 468crs while operating cash flows was Rs 485crs.
NAV: Shipping businesses globally are valued on NAV basis where assets are valued on the basis of valuation by shipbrokers adjusted for balance sheet items. Standalone NAV as on Q2FY19 was Rs 352/share and consolidated NAV was Rs 397-420/share. Asset values of crude tankers and product tankers should improve as freight rates move up. Consequently standalone NAV should improve. Globally, ship owners are trading at a discount to NAV.
Margin pressure in FY18 due to major increase in raw material prices especially caustic soda and manganese dioxide.
Around 50crs was lost in Sales due to forex movement
Will probably earn interest income in FY19 as they hope to turn debt free
Tax expense higher due to loss of R&D tax benefits in FY18
Difference in Other Income of around 12.5crs between standalone and consolidated is due to dividend income from subsidiary recognised in standalone and not in consolidated as per Ind-AS
Bulk Intermediates: Hope to hit 100% utilisation for plant manufacturing RFR on which additional sales of Rs 31crs can be realised in FY19.
Colors: Key player in denim. Seeing good demand there. 5-6 products in pipeline in HP pigments. Two plants closed in China which manufactured Vat dyes. Overall plants in China in this business segment has come down from 16 to 11 currently and will shut down more going forward.
Reasons why sales growth was subdued in FY18:
Aromatics business didn’t do well
Anticipated 200crs sales from Pharma but could do only 127crs
Sales of Sulphone declined as the aerospace industry didn’t buy from Atul which they hope will reverse in FY19
On China: China may have trouble producing some products which they used to produce earlier due to pollution or those products will get expensive due to investment in pollution control equipments. India is buying intermediates from China the prices of which may rise.
Top raw materials consumed in FY18 – Caustic soda, phenol, toluene, Epichlorohydrin, sulphur, manganese dioxide amongst others.
Capex: Around 100-150crs over next two years.
Hope to achieve Rs 4000crs Sales in FY20 from Rs 3000crs done in FY18.
I have compiled list of companies planning to raise funds from the market through various means and the amount they are looking to raise. As you can see from the table below, $11bn+ worth of paper supply can potentially come in the market over next one year as shareholder approval is valid for one year and the timeline for promoters to bring down their shareholding to 75% within 3 years of listing. This is just the secondary markets transactions.
1) At the peak of global financial crisis, Fareed Zakaria asked me a question at the WEF in Davos – What is a good bank for the future? My answer was, a good bank needs 3 human qualities : prudence, simplicity and humility.
2) Unlike 2009 which was a V-shaped capital markets led recovery, I believe that this time around capital markets may not fund the real sector companies easily but instead fund the bankswho may have to hold the can for the real sector. It is here that banks have to ask themselves whether their core business is lending or taking equity risks for debt rates of return.
3) On interest rates, I believe there will be a gradual reduction in cost of funds and lending rates. Reduction of deposit rates of say one year below 8% is a challenge. Particularly so because rates in small savings schemes continue to be above 8%.
4) On the other hand, bond markets are more benign and they will to some extent, enable recapitalization of banking system as a counter force to credit stress.
5) Three significant areas of opportunity:
i) Digital
ii) Affluent customers
iii) Non urban areas (i.e any place outside top 50 cities)
6) New Banks : How will they affect us? They will increase the pace of competition for talent and customers. However, going by our experience of last 10 years, banking, particularly on the retail side, is much long haul than we expected when we began our journey. With increasing complexity, I wonder whether we would have plunged into banking today as decisively as we did 10 years ago.
You may have a look at the profile and financials of the co’ here
Going forward, this is what the management says about FY14.
In FY13, other expenses shot up by approx. 100crs and finance cost came down by 24crs. Major portion of the other expenses was towards settlement of derivative losses.
Q4 of FY13 indicates how FY14 might shape up. Company ended Q4 with an EPS of Rs 6.39. So if we assume raw-material prices to remain stable and interest cost to fall by 15-18crs, Finolex may end up FY14 with an EPS of around Rs 18 and with the co’ paying out 50% of its earnings as dividend, ROE shoots up to 24%. So despite the sharp run up in the stock price, there is scope for another 30%+ price appreciation. Not considering sale of land parcel.
This post is basically a writeup to make sense of the significant debt of Arshiya. The common view among Investors is “I like the business model of the company but not the stock due to high leverage”.
Let’s start with the business model of Arshiya. One can refer to this excellent presentation by the company on the same. The company plans to open FTWZ across different parts of the country i.e In Panvel (West), Khurja (North), Nagpur (Central) and Chennai (South). Panvel FTWZ is partly operational (5 warehouses) and expected to be fully operational by June’13. Khurja FTWZ is partly operational (3 warehouses) and expected to be fully operational by the end of FY14. Company is in the process of acquiring land in Nagpur.
Arshiya’s stock price has not gone anywhere this year as earnings have been stable for four consecutive quarters (around Rs 35crs) as Depreciation and Interest expenses increased more than the EBIDTA. But one should look at the QoQ growth in EBIDTA and it has grown by around 16% for past two quarters and margins have grown from 26% to 29%. FTWZs have strong EBIDTA margins of 70%+. Once Panvel and Khurja FTWZs are fully operational, the overall margins can shoot to 35%+ which will ensure earnings increasing more than depreciation and interest expenses. Management is trying to contain expenses wherever possible. For example, they entered into lease agreement with GATX for rakes and conversion of rupee loan of Rs 300crs into dollar loan which acts as a natural hedge since income from FTWZ are in foreign currencies. Link for Q2FY13 Investor updates.
One of the concerns of the investors have been the high equity dilution (23%) recently through issuance of warrants to promoters. The fact that the issuance is not to an ‘outsider’ and the return on equity isn’t diluted mean the concern is unwarranted. Promoters have already converted 22.5% of the total issue. Its a case of promoters being more optimistic on its business than shareholders. Enterprise value stands at Rs 3335 crs with Equity (at current price of Rs 122) being Rs 885 crs (assuming full conversion of warrants) and Debt of Rs 2450 crs. My sense is incremental debt should be minimal going forward as funds raised through warrants and cash generated from ongoing projects once fully operationalized should be sufficient enough for capex of Nagpur FTWZ.
I think at 4x FY14 earnings, debt is discounted more than required. Considering the business model, competitive advantage and growth, Arshiya’s stock should possibly trade atleast 6x earnings or 1x P/BV for a 16% ROE going forward assuming no additional dilution. Such stocks generally does well in a bull market and declining interest rates scenario which hopefully will pan out over the next one year.
One can argue whether he deserves the tag or not or its too early to attach the tag. Hence the Question mark in the title.
Kenneth manages popular fund IDFC Premier Fund. Premier Fund’s AUM has grown from around 200crs in 2006 to around 4400crs currently. Fund has delivered 20%+ CAGR since launch and 15%+ over last 3 years. Had he not went overboard on PSU stocks in 2012, his fund would have been in top quartile now.
Let’s look at some of the portfolio’s holdings. I tried to find out the avg. purchase price through bulk deals and avg. qtrly price found earliest in the shareholding pattern.
Strides Arcolab -» Had first acquired 4.38 lac shares @ 63 in Feb’09. Almost 15 bagger now. Exited.
Bata India -» Avg. price of 100 during the Dec’08 Qtr. That’s around 12 bagger in 5 and half years!
Page Industries -» Avg. Price of 400 during the June’07 Qtr. 18.5x now. 10%+ dividend yield on top of that.
Kaveri Seeds -» Avg. price of Rs 50 (adjusted for split). Around 14.5x since first entered.
VST Industries -» Acquired 2.22 lac shares @ 575 during Oct’10. More than 3x now. Exited.
Blue Dart Express -» Acquired 1.82% stake at an avg. price of 650 during the June’08 quarter. 6x now.
MRF ->> Avg. Price of Rs 10,000 during the Sept’12 Qtr. 2.3x now.
Coromandel International ->> Avg. Price of Rs 75 (adjusted for split) during Sept-Dec’08 Qtr. Around 3.5x now.
Doubled his returns in Hexaware and e-clerx. Both exited.
Other holdings like Asian Paints,GSK Consumer and STFC have delivered steady returns.Exited.
Pantaloon and IRB Infra are among the few stocks which didn’t played out for the fund.
P.S. Fine. We will attach the tag after the next bear market!